Percentile for Undgrouped Data
Percentiles
The percentiles are the ninety-nine score points which divide a distribution into one hundred equal parts, so that each part represents the data set. It is used to characterize values according to the percentage below them. For example, the first percentile (P₁) separates the lowest 1% from the other 99%, the second percentile (P₂) separates the lowest 2% from the other 98%, and so on.
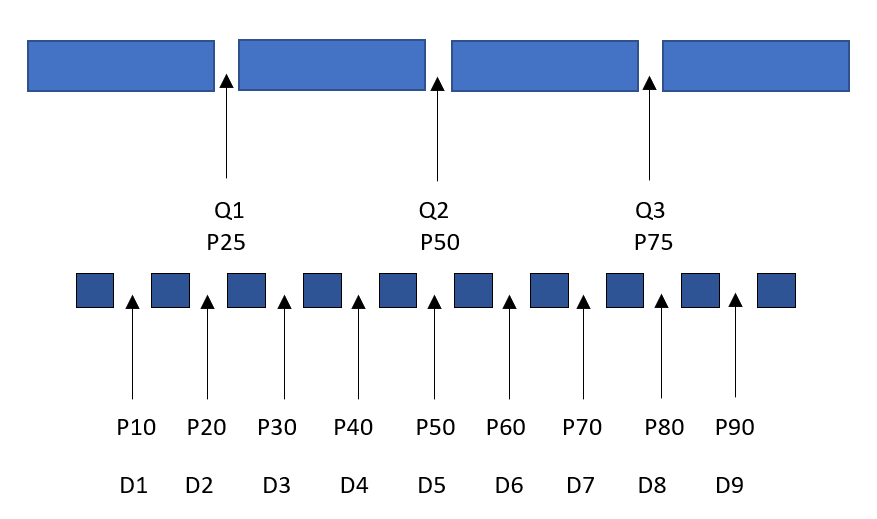
The percentiles determine the value for 1%, 2%, …, and 99% of the data. P₃₀ or 30th percentile of the data means 30% of the data have values less than or equal to P₃₀.
The 1st decile is the 10th percentile (P₁₀). It means 10% of the data is less than or equal to the value of P₁₀ or D₁, and so on.
Example 1
Find the 30th percentile or P₃₀ of the following test scores of a random sample of ten students: 35, 42, 40, 28, 15, 23, 33, 20, 18, and 28.
Solution
First, Arrange the scores from the lowest to the highest.
15 18 20 23 28 28 33 35 40 42
Steps to find percentile value on a data with n elements:
To find its P30 position, use the formula k(n + 1)/100 and round off to the nearest integer.
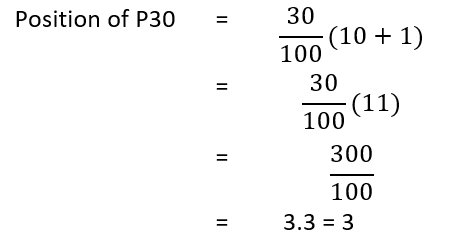
P30 is the 3rd element.
Therefore, P30 = 20