Quartile for Ungrouped Data
Quartiles
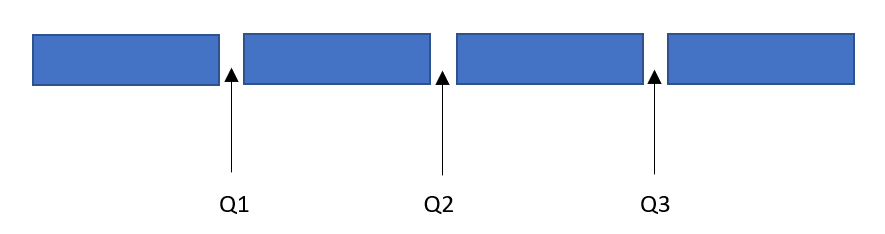
The quartiles are the score points which divide a distribution into four equal parts. Twenty-five precent (25%) of the distribution are below the first quartile, fifty percent (50%) are below the second quartile, and seventy-five percent (75%) are below the third quartile. Q1 is called the lower quartile and Q3 is the upper quartile. Q1 < Q2 < Q3, where Q2 is also called the median. The difference between Q3 and Q1 is the interquartile range.
Since the second quartile is equal to the median, the steps in the computation of the median by identifying the median class is the same as the steps in identifying the Q1 class and the Q3 class.
The midpoint between two numbers x and y on the real number line is (x+y)/2.
a. 25% of the data has a value ≤ Q1
b. 50% of the data has a value of ≤ X or Q2
c. 75% of the data has a value of ≤ Q3
Example 1
The owner of a coffee shop recorded the number of customers who came into his café each hour in a day. The results were 14, 10, 12, 9, 17, 5, 8, 9, 14, 10, and 11. Find the lower quartile and upper quartile of the data.
Solution
• In ascending order, the data are
5, 8, 9, 9, 10, 10, 11, 12, 14, 14, 17
• The least value in the data is 5 and the greatest value in the data is 17.
• The middle value in the data is 10.
• The lower quartile is the value that is between the middle value and the least value in the data set.
• So, the lower quartile is 9.
• The upper quartile is the value that is between the middle value and the greatest value in the data set.
• So, the upper quartile is 14.
Example 2
Find the average of the lower quartile and the upper quartile of the data.
Solution
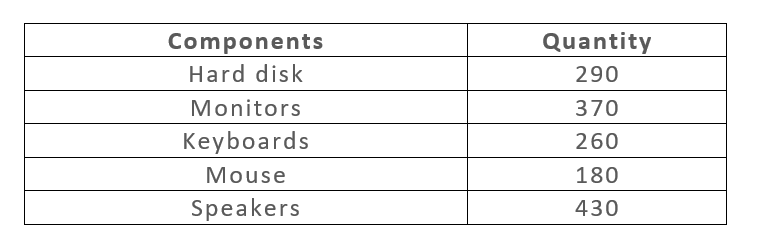
• In increasing order, the data are 180, 260, 290, 370, 430.
• The least value of the data is 180 and the greatest value of the data is 430.
• The middle value of the data is 290.
• The lower quartile is the value that is between the least value and the middle value.
• So, the lower quartile is 260.
• The upper quartile is the value that is between the greatest value and the middle value.
• So, the upper quartile is 370.
• The average of the lower quartile and the higher quartile is equal to 315.
Example 3
The lower quartile of a data set is the 8th data value. How many data values are there in the data set?
Solution
• The lower quartile is the median data value of the lower half of the data set.
• So, there are 7 data values before and after the lower quartile.
• So, the number of data values in the lower half is equal to 7 + 7 + 1.
• The number of values in the data set is equal to lower half + upper half + 1.
• The number of values in the lower and upper halves are equal.
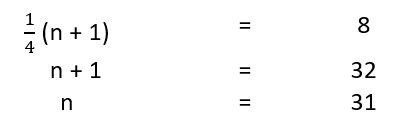
• Formula:
15 + 15 + 1 = 31
• So, the data set contains 31 data values.
Another Solution: