Quartile for Grouped Data
Quartiles
The steps in computing the median are similar ro that of Q1 and Q3. In finding the median, we first need to determine the median class. In the same manner, the Q1 and the Q3 class must be determined first before computing for the value of Q1 and Q3. The Q1 class is the class interval where the (N/4)th score is contained, while the class interval that contains the (3/V/4)th score is the Q3 class.
In computing the quartiles of the grouped data, the following fomula is used:
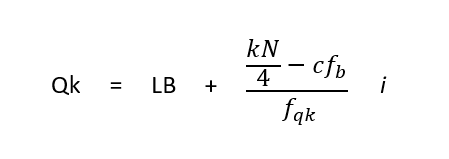
where:
LB = lower boundary of the Qk class.
N = total frequency.
cfb = cumulative frequency of the class before the the Qk class.
fq1 = frequency of the Qk class.
i = size of the class interval.
k = nth quartile, where n = 1,2, and 3.
Example 1
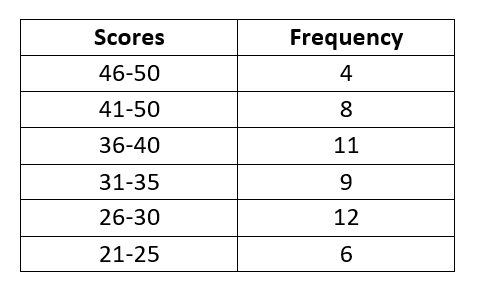
Calculate the Q1, Q2 and A3 of the Math test scores of 50 students.
Solution
This means we need to find the class interval where the 12.5th score is contained.
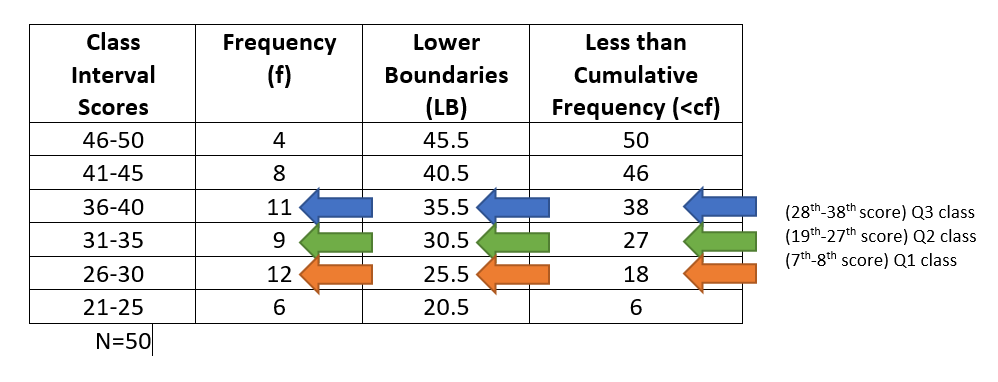
Note that the 7th-18th scores belong to the class interval: 26-30.
So the 12.5th is also within the class interval.
The Q1 class is class interval 26-30.
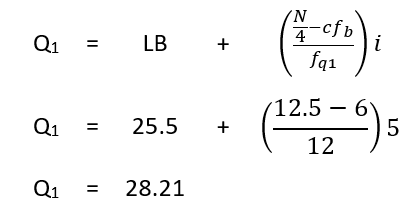
Therefore, 25% of the students have a score less than or equal to 28.21.
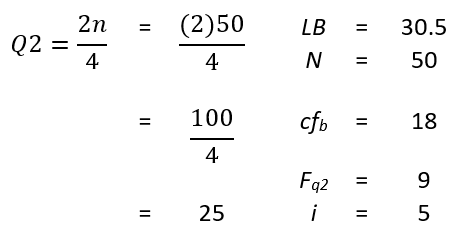
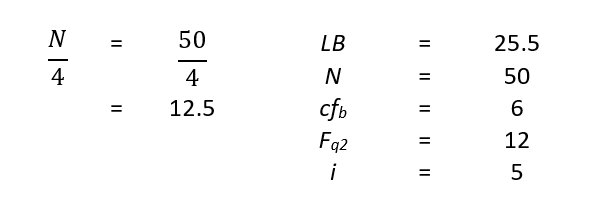
This means we need to find the class interval wherethe 25th score is contained.
Note that the 19th-27th socres belong to the class interval: 31-35. So, the 25th score is alos within the same class.
The Q2 class is the class interval 31-25.
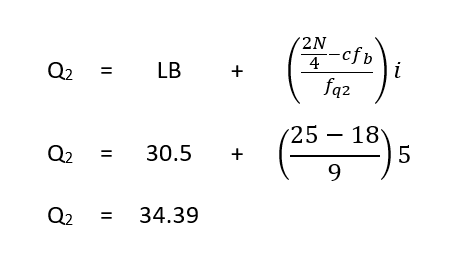
Therefore, the 50% of the students have a score less than or equal to 34.39.
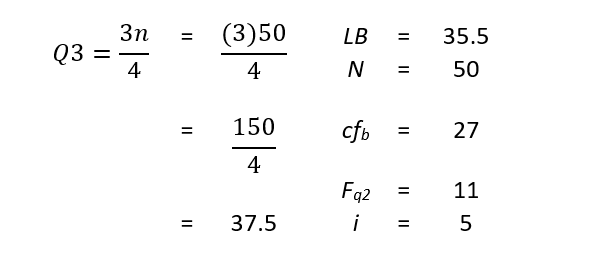
This means we need to find the class interval where the 37.5th score is contained.
Note that the 28th-38th scores belong to the class interval: 36-40. So, the 37.5th score is also within the class interval.
The Q3 class is the class interval 36-40.
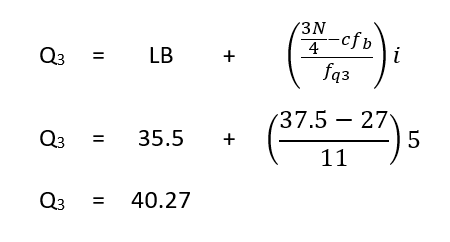
Therefore, the 75% of the students have a score less than or equal to 40.27. The third quartile 40.27 falls within the class boundaries 36-40 which is 35.5-40-5.