Percentiles for Grouped Data
Deciles
The percentile of grouped data is used to characterize values according to the percentage below them.
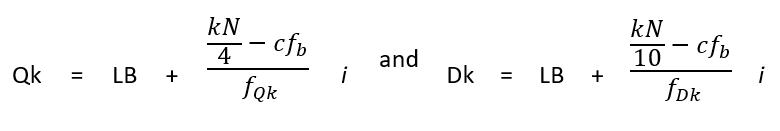
Early on, you have already learned that kth quartile denoted by Qk and the kth deciles denoted by Dk are computed, respectively, as follows:
Finding percentiles of a grouped data is similar to that of finding quartiles and deciles of a grouped data.
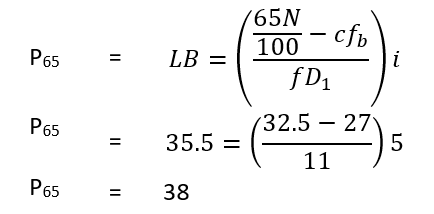
The kth percentile, denoted by Pk is computed as follows:
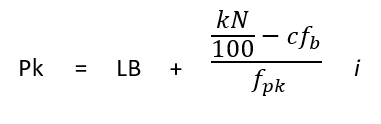
where:
LB = lower boundary of the percentile class.
N = total frequency.
cfb = cumulative frequency of the class before the the percentile class.
fdk = frequency of the percentile class.
i = size of the class interval.
k = nth quartile, where n = 1,2, 3......, 97, 98, and 99.
Example 1
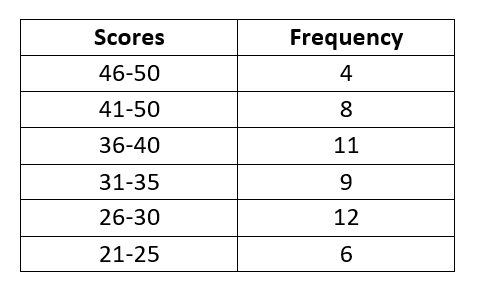
Find the 65th percentile and 32nd percentile of the Mathematics test scores of 50 students.
Solution
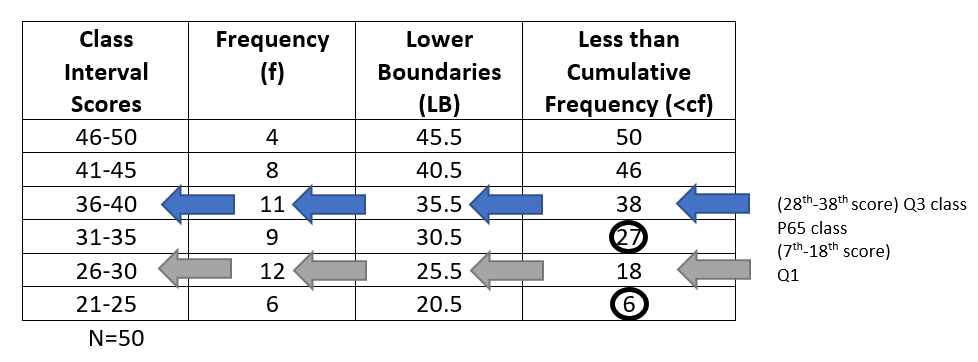
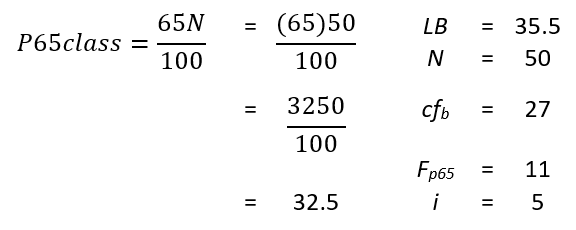
This means we need to find the class interval where the 32.5th score is contained.
Note that the 28th-38th scores belong to the class interval: 36-40.
So the 32.5th is also within the class interval.
The P65 class is class interval 36-40.
Therefore, 65% of the students got a score less than of equal to 36-40.
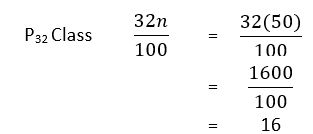
This means we need to find the class interval where the 16th score is contained.
Note that the 7th-18th scores belong to the class interval: 26-30.
So the 32.5th is also within the class interval.
The P32 class is class interval 26-30 .
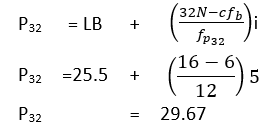
Therefore, 32% of the students got a score less than or equal to 29-67.